Correlation coefficient
According to most math books, the correlation coefficient is the linear association between two variables. Bottom line: correlation coefficient shows the relationship (or, association) between two things.
The correlation coefficient NEVER shows or proves causation. A USMLE high yield question may include answers with the word “cause” in it. Never select an answer-choice with the word “cause” in it.
Pictures are worth a thousand words so the USML Ebiostatistics workbook provides pictures and arrows that highlight everything you need to know about this topic.
Core concepts of the correlation coefficient
The Correlation Coefficient is a number between, -1 and 1 (including -1 & 1), and is denoted by the letter, “r” (e.g., r = 0.78). r provides the direction & strength of a correlation between two things – the, “linear association between two variables.”
Solving / answering high yield Case-fatality questions
Focus on one and only one row; focus on the row of the specific illness or condition being questioned. All other rows are irrelevant AND you will ~never use the percentages (if given) to compute the answer.
Let’s say the question is, “What is the case-fatality rate for pancreatic cancer?”
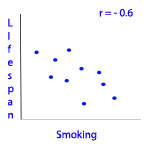
Negative Correlation (lifespan as smoking )
If r is between -1 & -0.1, then the direction is .-1 = perfectly negative correlation (maximum strength), so a -0.6
represents a mildly-strong association.

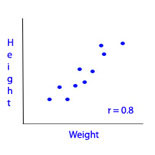
Positve Correlation ( height as weight )
If r is between +0.1 & +1, then the direction is .
+1 = perfectly positive correlation (maximum strength), so a +0.8
represents a strong association.

Here’s a general scale for Correlation Coefficient’s strength:

Solving / answering high yield correlation coefficient questions
Questions may provide scatter plots (the easiest) or, entirely in the form of a word problem (trickiest). Calculations are not required; instead, it’s entirely conceptual.
A high yield question designed to confuse the examinee could provide a positive r, p=0.02, but frame the answer so the correct choice involves two decreasing variables. I provide practice questions that address this.
The USMLE biostat workbook describes this topic by using many pictures, additional details, a wide variety of word-problems with thorough explanations, and much more. Buy now!